
Managing Finance Reporting Hierarchies - Best Practice
A reporting hierarchy is the set of parent-child relationships that roll up base-level codes into the financial groupings and levels used for reporting. The catch is that a single set of codes rarely rolls up just one way.
Take a set of Cost Centers. The regional CFO wants to see them rolled up by geography, the COO wants them by business unit, and group consolidation needs them by legal entity. It's the same underlying codes every time, but each audience needs its own reporting tree. The chart of accounts is no different: one GL account set has to feed a management-accounts view and a statutory-reporting view, and each of those trees has people downstream who depend on it being accurate and up to date. In practice, most finance teams are maintaining several of these hierarchies side by side.
These alternate hierarchies are usually needed purely for reporting and analysis, not for running the business day to day, so they almost never live in the source system and aren't handed to you ready-made. Someone, somewhere, has to build them and keep them current as the business reorganises. More often than not, that "someone" is a business user nursing a spreadsheet, or a developer who has hard-coded the rollups into the data pipeline. Neither is really a home for data this important, and that is the heart of the problem.
Spreadsheets and Hard-Coding are a Problem
Most Finance departments handle multiple hierarchies with multiple tabs maintained in a spreadsheet. When a reorg adds a Cost Centre, they update the spreadsheet, export a CSV, and the Data Warehouse ETL pipeline picks it up.
Unfortunately this works initially, but over time issues creep-in. The spreadsheet has no validation against the base code list, so typos and orphaned nodes appear. There's no versioning, so when someone asks what the hierarchy looked like in Q3, nobody can answer. When the COO's numbers don't match the CFO's, nobody can explain why. And when the spreadsheet owner goes on leave (or leaves all-together), no one can find the spreadsheet to fix the issue with the Board report!
Hard-coded SQL is the other common approach. The hierarchy lives in CASE statements in a python notebook in your data warehouse. More stable than a spreadsheet, but every change requires a developer to change code and deploy through environments. It's friction you just don't need. Every new Cost Centre becomes a backlog ticket.
A better way to manage Finance hierarchies
A better way to manage these hierarchies exists, but it's worth understanding why analytics and reporting developers so rarely reach for it, and why they fall back to spreadsheets and hard-coding instead. A data warehouse or reporting platform is the wrong tool for the job. It's built to be read-only. It ingests data from source systems and serves it up for analysis. It isn't designed to let a business user sit down and edit values directly. So when finance needs somewhere to maintain a hierarchy, there's simply no natural home for it inside the platform the developer controls.
Faced with that gap, the developer takes the path of least resistance. A spreadsheet is something the business user already knows and can own, and hard-coded SQL is something the developer can stand up in an afternoon. Neither requires building and maintaining a whole editing application, which is really what the problem calls for. That's the crux of it: properly solving this means giving business users a dedicated, flexible UI with validation built in, and wiring that back into the data platform, and that's a long way outside what a reporting developer is set up to deliver.
This is exactly the gap a dedicated Reference Data Management (RDM) application fills. A good RDM application will provide:
- A central user interface. Business users need one place to build and maintain their hierarchies, shared across a team and, where needed, gated behind an approval workflow so changes are reviewed before they take effect. For our example, that means finance can open a single tool and edit the geography, business-unit, and legal-entity rollups for their Cost Centres, rather than each person keeping a private copy.
- Data syncing. As new base codes are created in the source system, they should flow automatically into the tool and appear ready to be slotted into a hierarchy. So when a new Cost Centre is set up in the ERP, it shows up in the mapping table waiting to be assigned to a parent, instead of someone having to notice it and type it in by hand.
- Referential integrity. The tool should enforce the rules of a valid hierarchy: every base code is accounted for, nothing is orphaned, and each code maps to a real, existing level exactly once. In practice that stops a Cost Centre from being left unmapped, double-counted under two parents, or attached to a hierarchy level that doesn't exist.
- Ingestion. Once the hierarchies are maintained, getting them back into the data platform should be effortless and repeatable, not a manual export. For our example, an updated Cost Centre rollup should land in the warehouse ready for the dimension build without anyone shuffling CSVs around.
- Versioning. Every change should be captured with its effective date so you keep a full history and can report as at any point in time. When a Cost Centre moves from one parent to another, the old relationship is end-dated and a new one created, giving you point-in-time reporting and a clear audit trail of who changed what and when.
- Testing. Changes should be verifiable in a lower environment before they hit production reporting. That lets finance restructure a Cost Centre hierarchy in Dev or Test, confirm the totals still add up correctly, and only then promote the change, rather than discovering a broken rollup in the Board pack.
Using this governed approach you provide the "self-service" convenience of spreadsheets without all the pitfalls of validity, integrity, versioning and access. And the end user never has to raise a ticket just to map a new Cost Center to a hierarchy group.
Here's how TitanRDM solves reporting hierarchy maintenance
The following diagram depicts how TitanRDM (a dedicated reference data management system) enables the maintenance of multiple reporting hierarchies. Note this is just one use-case for TitanRDM, its flexible and configurable for all your mapping, categorizing, augmenting hierarchizing etc. needs.
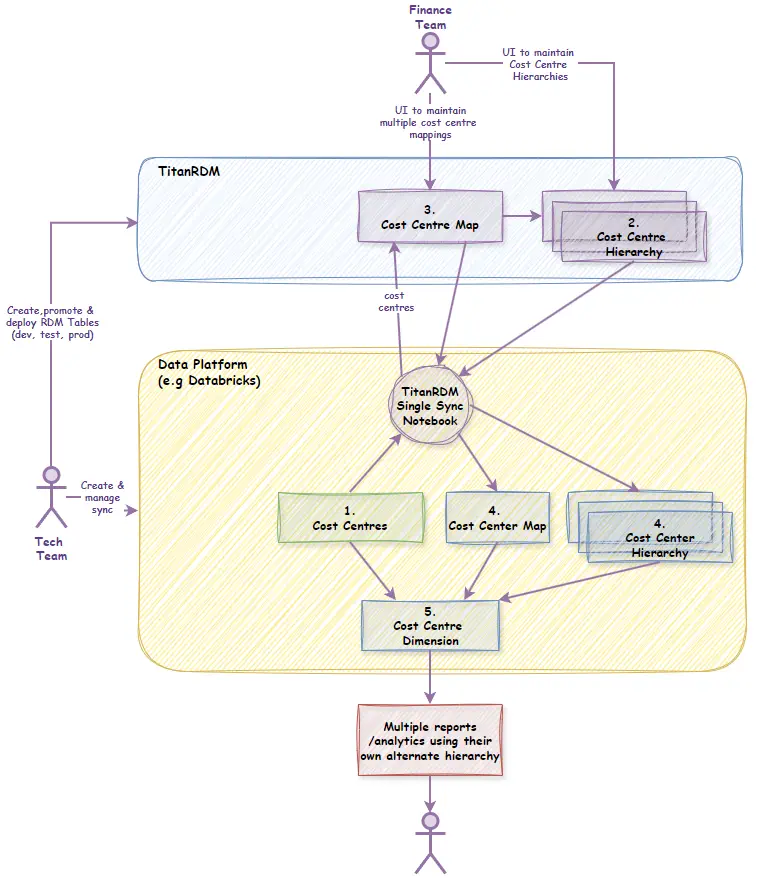
- Sync your base codes into TitanRDM. Your Cost Centres already exist on your data platform. TitanRDM provides a sync SDK that lets a single notebook, running on that platform, push them into TitanRDM using simple conventions. The sync creates and updates rows in the "Cost Centre Map" table, so new Cost Centres automatically become available for mapping and retired ones are soft-deleted. The same notebook can sync all of your reference data, not just Cost Centres.
- Define each hierarchy. The finance team maintains one "Cost Centre Hierarchy" table per alternate hierarchy, for example one for geography, one for business unit, and one for legal entity. Each table holds a row for every node in that tree, and the nodes themselves can form their own parent-child structure to describe the levels of the hierarchy.
- Map Cost Centres to each hierarchy. The finance team then maps every Cost Centre to a node in each hierarchy, all within the "Cost Centre Map" table. That table lists the Cost Centre codes and descriptions, with an added column for each alternate hierarchy, and every column links to its matching "Cost Centre Hierarchy" table. Because the mapping can only point at valid nodes, this enforces validity and referential integrity. For a ragged parent-child hierarchy, the column simply points back at the "Cost Centre Map" table itself.
- Sync the maintained data back to your platform. The same TitanRDM sync process runs in reverse, pulling the updated "Cost Centre Map" and "Cost Centre Hierarchy" tables back into a copy on your data platform.
- Build the dimension. With the maps and hierarchies now sitting on the data platform, you have everything needed to build a Cost Centre dimension that carries all of its alternate hierarchies at once.
- Report against any hierarchy. Report developers and data analysts simply pick the Cost Centre hierarchy that suits the question in front of them, whether that's geography for the regional CFO, business unit for the COO, or legal entity for consolidation.
Comparison of approaches
| Approach | Versioning | Business-user ownership | Validation | API consumption |
|---|---|---|---|---|
| Spreadsheet | None | Yes, fragile | Manual | CSV export |
| Hard-coded SQL | Git history | No | None | None |
| MDM platform | Full | Yes | Yes | Heavy |
| TitanRDM | Full | Yes | Yes | Yes |
Spreadsheets and SQL don't scale past the first reorg. MDM platforms solve the problem but need significant implementation effort and licensing costs. For teams that need governed, versioned hierarchies with business-user ownership and API/SDK consumption, a purpose-built tool like TitanRDM sits between spreadsheet chaos and full MDM. Business users maintain rollups with audit trails, and pipelines consume them programmatically.
Try for yourself
Ready to get your reporting hierarchies out of spreadsheets? Sign up for the TitanRDM free edition and start mapping your first hierarchy in minutes — no credit card, no implementation project.
FAQ
What is a reporting hierarchy?
A reporting hierarchy is the set of parent-child relationships that roll up base-level codes, like Cost Centres or GL accounts, into the groupings and levels used for reporting.
Why does the same set of codes need more than one hierarchy?
Different consumers roll the same codes up differently. One set of Cost Centres might roll up by geography for the regional CFO, by business unit for the COO, and by legal entity for group consolidation. Same codes, different trees, different audiences.
What's a ragged hierarchy?
A ragged hierarchy is a parent-child hierarchy where branches don't all go to the same depth, e.g. some Cost Centres roll up through three levels before reaching a group total, while others roll up through five. Most warehouses manage these in a spreadsheet with one parent-child mapping per row.
What's wrong with managing hierarchies in a spreadsheet?
Spreadsheets have no validation against the base code list, so typos and orphaned nodes creep in. There's no versioning, so nobody can say what a hierarchy looked like at a past date, and when the spreadsheet owner leaves, no one can find or maintain it.
Why not just hard-code the hierarchy in SQL?
Hard-coded SQL (e.g. CASE statements in a stored procedure) is more stable than a spreadsheet, but every change needs a developer to update code and deploy it through environments. Every reorg becomes a backlog ticket instead of a self-service update.
How does TitanRDM manage multiple reporting hierarchies?
TitanRDM syncs Cost Centres from your data platform into a "Cost Centre Map" table, while the Finance team maintains one "Cost Centre Hierarchy" table per alternate hierarchy and maps codes to each in the Cost Centre Map. Changes sync back to the data platform, giving you a Cost Centre dimension with multiple validated, versioned hierarchies.