Navigating the UI
Available to: All users Minimum plan: Free
This guide walks you through the TitanRDM interface — the dashboard, the sidebar navigation, branch switching, and other key UI elements.
Dashboard
The dashboard is your home screen when you sign in. It adapts based on your role and licence type, showing the sections most relevant to you.
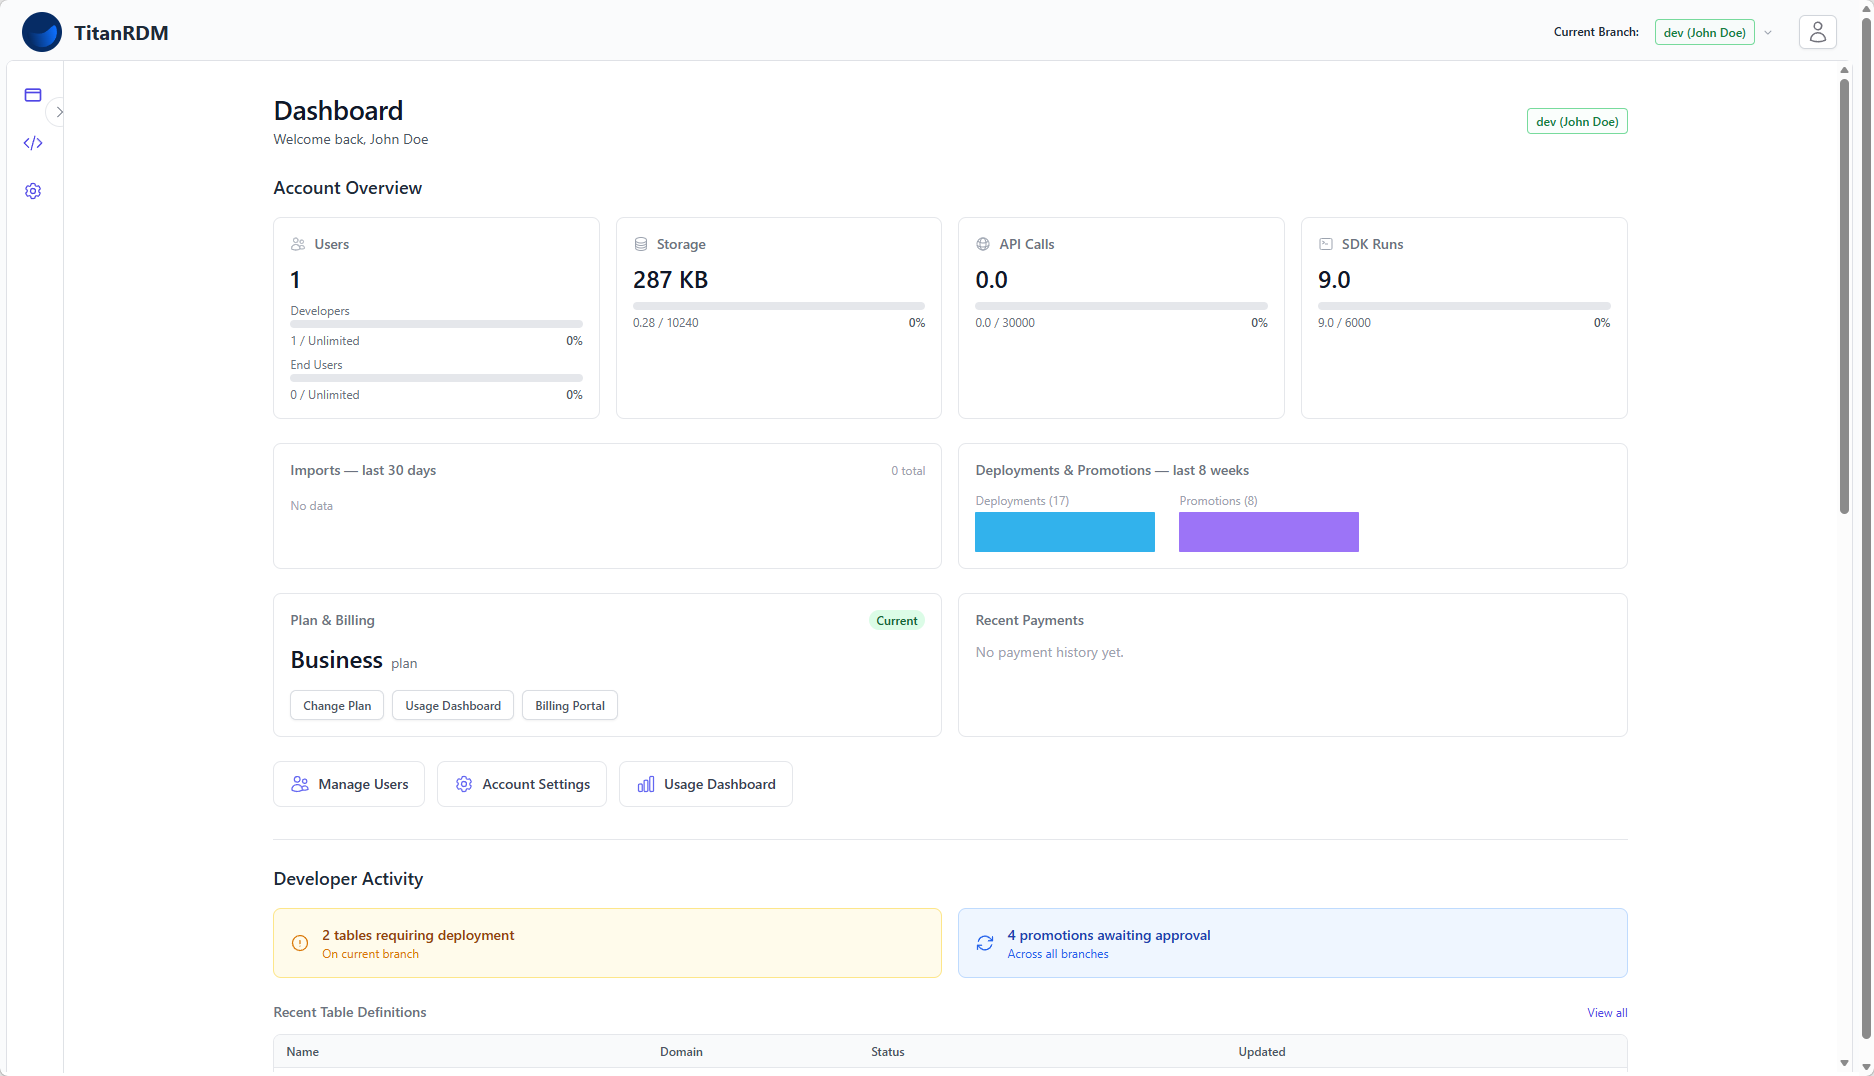
Admin Panel
Visible to Account Administrators. Shows:
- Account overview — user count (developers and end users), storage usage, API call usage, and SDK run usage, each with progress bars against your plan limits
- Import and deployment sparklines — 30-day import activity and 8-week deployment/promotion trends
- Plan and billing — current plan, billing status, quick links to Change Plan, Usage Dashboard, and Billing Portal
- Recent payments — latest billing events from Stripe
- Quick shortcuts — links to Manage Users, Account Settings, and Usage Dashboard
Developer Panel
Visible to users with a Developer licence. Shows:
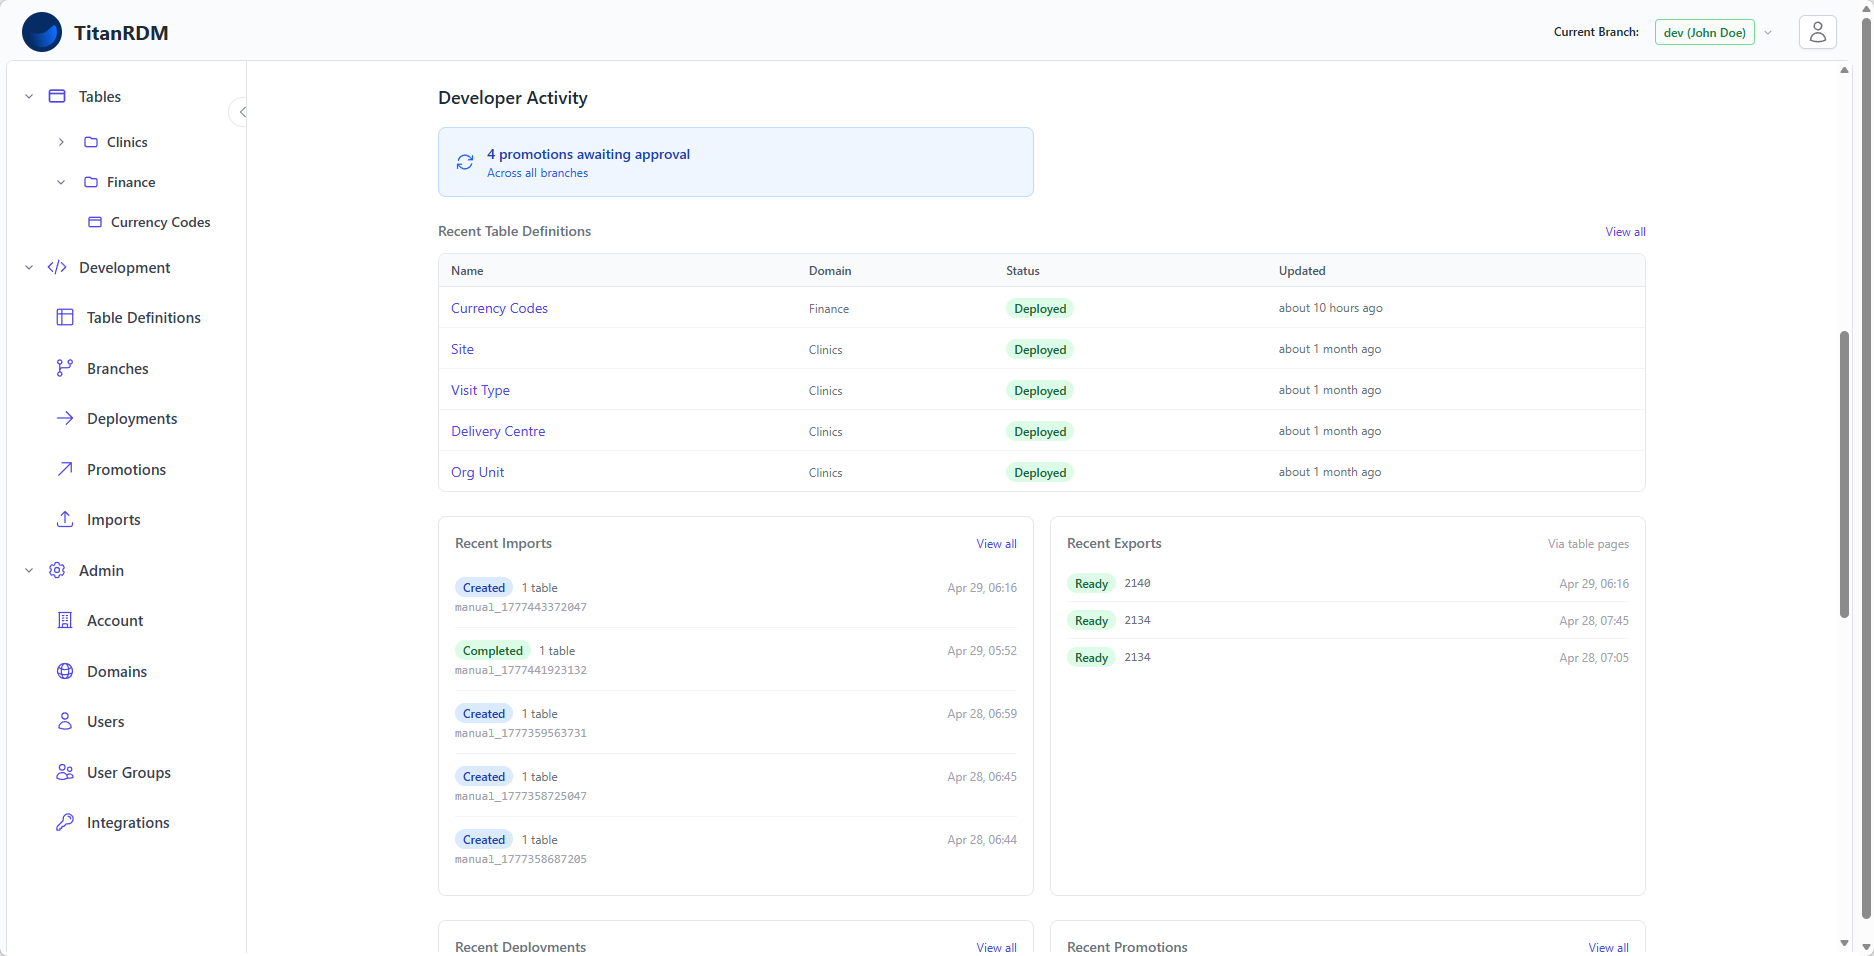
- Pending action cards — tables requiring deployment on the current branch, and promotions awaiting approval across all branches
- Recent table definitions — the latest table definitions on your current branch, with domain, deployment status, and last updated time
- Recent imports and exports — side-by-side lists of recent import and export activity with status badges
- Recent deployments and promotions — side-by-side lists showing branch, status, and timestamps
End User Panel
Visible to all users (including developers). Shows:
- Your tables — quick access to the tables you work with most frequently
- Recent activity — your recent data edits
Sidebar Navigation
The sidebar on the left is your primary navigation. It is organised into three expandable sections.
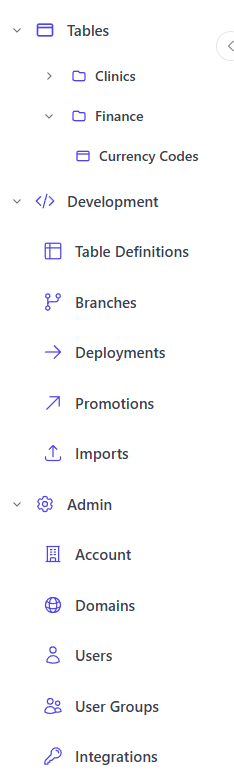
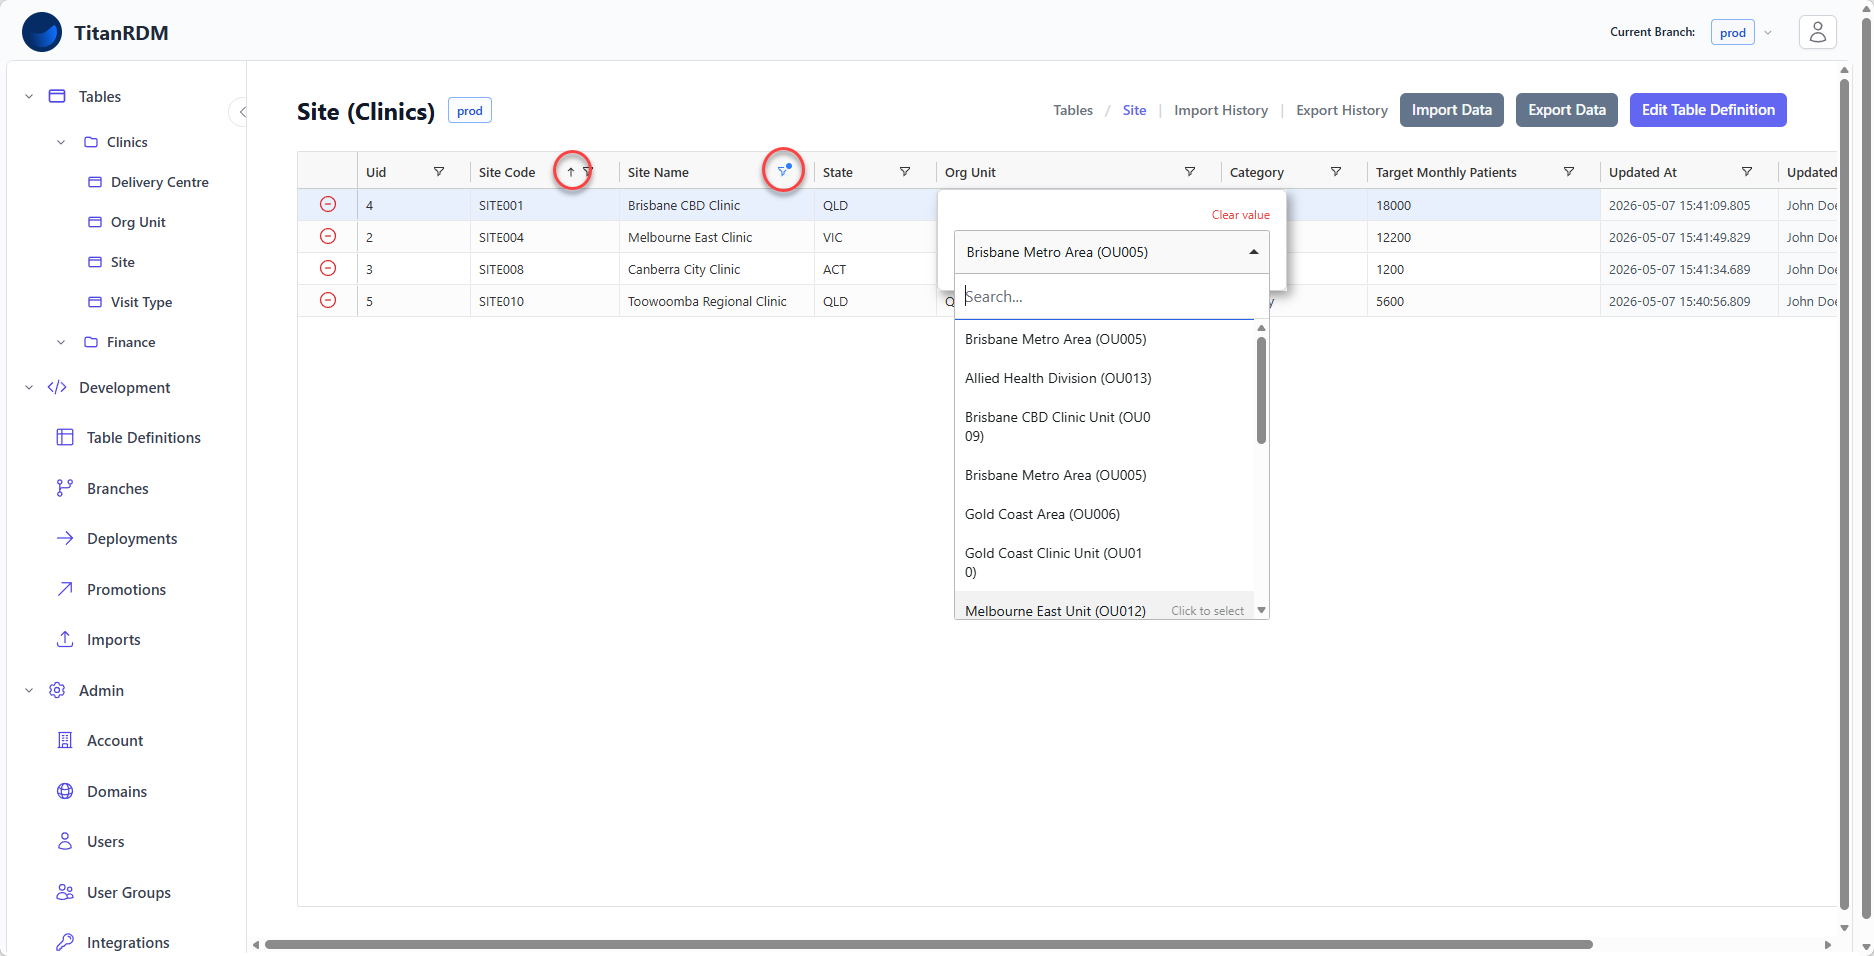
Tables
The top section of the sidebar shows your deployed tables, organised by domain.
- Click a domain name to expand it and see its tables.
- Search to find a table within the domain.
- Click a table name to open the data grid.
This section is visible to all users and is the primary way end users access data.
Tip: The table list reflects your current branch. When you switch branches, the sidebar updates to show the tables deployed on that branch.
Development
This section contains the tools developers use to manage table structures and the change lifecycle:
| Menu Item | Description |
| Table Definitions | Create, edit, and manage table structures and column definitions |
| Branches | View and manage permanent and private developer branches |
| Deployments | Create and manage deployments — apply table definition changes to the database |
| Promotions | Create and review promotions — move changes between branches |
| Imports | View import history and status |
Note: End Users see these menu items greyed out with a "Developer licence required" tooltip. Some items (Branches, Promotions) are also greyed out on plans that do not support branching.
Admin
This section contains account and access management tools:
| Menu Item | Description |
| Account | View and edit your organisation name, subdomain, plan, and billing |
| Domains | Create and manage information domains (subject areas) |
| Users | Add, edit, and remove users; manage licence types |
| User Groups | View and manage user groups and their members |
| Integrations | Create and manage OAuth applications for API access |
Note: Admin menu items are only accessible to users with a Developer licence and appropriate permissions. End Users see these items greyed out.
Branch Switcher
Your current branch is displayed in the top-right area of the dashboard and in the header. To switch branches:
- Click the branch name in the header
- Select a different branch from the dropdown
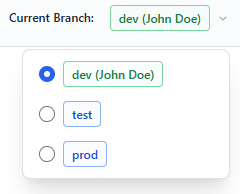
When you switch branches: - The Tables section in the sidebar updates to show tables deployed on the new branch - Table Definitions shows the definitions on the new branch - Deployments and Promotions are filtered to the new branch
Note: All plans include Development, Test, and Production branches, so the branch switcher is available on every plan.
Search
Most list pages in TitanRDM include a search bar at the top. Search works across multiple fields:
- Table Definitions — search by name, database table name, description, or key
- Branches — search by name, suffix, description, status, type, or parent branch name
- Domains — search by name, abbreviation, description, or ID
- Users — search by name or email
- User Groups — search by name
The dashboard also includes a global search that lets you quickly find tables across all domains.
Header Bar
The header bar at the top of every page contains:
- Current branch indicator — shows your active branch with a colour-coded badge (red for permanent branches, green for private feature branches, blue for shared branches)
- User menu — click your avatar or name to access your profile settings, or sign out
Dark Mode
TitanRDM supports dark mode. The UI automatically follows your system preference (light or dark). You can see both themes reflected throughout the interface — all elements including the sidebar, data grid, forms, and dashboards adapt to your chosen theme.
Data Grid
The data grid (powered by AG Grid) is the central interface for viewing and editing reference data. Key features:
- Inline editing — click any cell to edit it directly
- Column sorting — click a column header to sort; click again to reverse
- Column filtering — right-click a column header for filter options
- Column resizing — drag column borders to resize
- Row selection — click to select rows for bulk actions (e.g., delete)
- Add Row — add new records (if the table allows manual row entry)
- Foreign key lookups — columns referencing other tables show a dropdown of valid values
- Date/time pickers — date and timestamp columns show native date/time pickers
- Valid value dropdowns — columns with defined valid values show a dropdown selector
What's Next
- Create your first table — if you have not already
- Learn about the key concepts — domains, branches, deployments, promotions